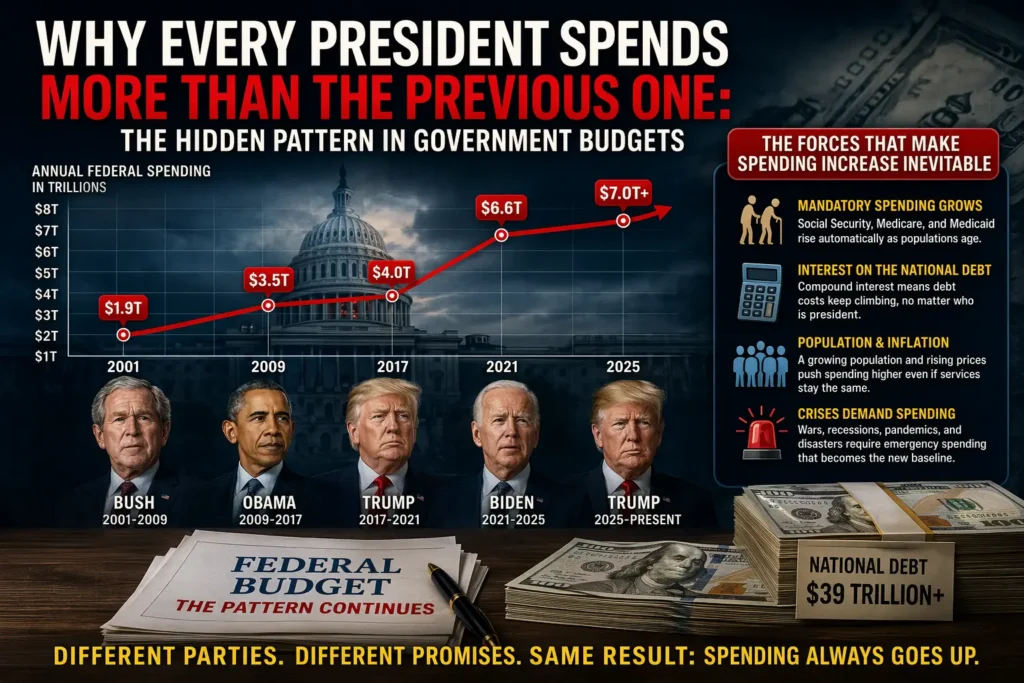
One remarkable pattern emerges when examining presidential fiscal records across American history: regardless of political party, economic philosophy, or campaign promises to reduce spending, virtually every modern president has overseen an increase in government spending compared to their predecessor. This isn’t coincidence or incompetence—it’s the mathematical reality of governing a growing nation with expanding populations, aging demographics, and mounting obligations that make spending reduction nearly impossible without fundamental systemic changes that neither party has proven willing to implement.
Understanding why this pattern persists requires looking beyond partisan talking points about fiscal responsibility or wasteful spending. The forces driving ever-increasing government budgets are structural, demographic, and mathematical rather than ideological. From mandatory spending programs that grow automatically each year to interest payments on accumulated debt that compound relentlessly, presidents inherit fiscal trajectories largely determined by decisions made decades before they took office. This comprehensive analysis explores the mechanisms that ensure each administration spends more than the last, examines specific presidential records, and explains why breaking this pattern would require political courage that has eluded leaders from both parties for generations.
The Structural Realities Driving Spending Increases
Before examining individual presidential records, it’s essential to understand the fundamental factors that make spending reduction extraordinarily difficult regardless of who occupies the White House. These structural realities create powerful headwinds against any president attempting to significantly reduce the federal budget, explaining why even the most fiscally conservative campaigns inevitably govern over spending increases.
Mandatory Spending Growth on Autopilot
Approximately two-thirds of federal spending—roughly $4.7 trillion annually in 2026—consists of mandatory programs that operate on autopilot without requiring annual congressional appropriation. Social Security, Medicare, and Medicaid dominate this category, with spending levels determined by formulas established in their authorizing legislation rather than discretionary budget decisions. As baby boomers continue retiring in massive numbers—roughly 10,000 Americans turn 65 daily—Social Security and Medicare enrollment grows automatically, driving spending higher regardless of presidential priorities or budget negotiations.
The mathematics are inexorable. Social Security benefits are calculated based on recipients’ earnings histories and cost-of-living adjustments that automatically increase payments to match inflation. Medicare costs rise not only from enrollment growth but also from medical inflation that consistently outpaces general price increases, as new treatments, technologies, and pharmaceutical innovations drive healthcare costs higher. Medicaid spending expands both from aging populations requiring nursing home care and from program expansions that states implement during economic downturns when more residents qualify based on income thresholds.
Together, these three programs consumed $2.8 trillion in 2025 and are projected by the Congressional Budget Office to reach $3.6 trillion by 2030, representing spending growth of nearly $1 trillion over just five years without any new legislation expanding benefits or eligibility. Presidents can propose reforms to slow this growth—raising retirement ages, means-testing benefits, or negotiating drug prices—but such changes face fierce political opposition from AARP and other advocacy groups representing tens of millions of voters. Consequently, mandatory spending continues its upward trajectory administration after administration, regardless of which party controls the presidency or Congress.
Compound Interest on National Debt
Perhaps no factor drives spending increases more relentlessly than interest payments on the national debt, which has grown from $5 trillion in 2000 to over $39 trillion in 2026. Interest costs now represent the fastest-growing category of federal spending, consuming approximately $900 billion annually—more than the entire Defense Department budget and triple the amount spent on interest just a decade ago. This represents money that buys absolutely nothing for Americans, funding no programs, building no infrastructure, and providing no services beyond servicing past borrowing.
The compound nature of interest creates vicious cycles that accelerate spending growth. When annual budgets run deficits, the government must borrow to cover the shortfall, adding to total debt and thereby increasing future interest obligations. Those higher interest costs then widen future deficits, requiring even more borrowing that generates still more interest expense in an ever-expanding spiral. According to Brookings Institution analysis, interest costs are projected to consume 31% of federal revenues within a decade and more than half of all revenues by 2056 if current policies continue unchanged.
Rising interest rates have dramatically accelerated this problem. When the federal government could borrow at near-zero rates during the 2010s, massive debt increases generated relatively modest interest costs. However, with rates rising from near zero in 2020 to 4-5% by 2024, each new dollar borrowed costs exponentially more to service. Additionally, as older low-interest bonds mature and get replaced with new higher-rate debt, average interest costs on existing debt steadily climb. This creates the perverse situation where even if a new president somehow balanced the budget on day one, total spending would still increase annually simply from rising interest on debt accumulated by predecessors.
Inflation and Population Growth
Basic mathematical realities ensure that government spending increases in nominal dollar terms even when real per-capita spending remains flat. With U.S. population growing by approximately 0.5% annually—adding 1.6 million people each year—and inflation averaging 2-3% historically, maintaining exactly the same level of government services per person requires spending growth of roughly 2.5-3.5% annually. This means a president maintaining the previous administration’s spending levels in real terms would still see budget totals increase by hundreds of billions of dollars over a four-year term.
This creates political messaging challenges, as opponents can accurately claim that a president “increased spending” even when real per-capita spending decreased. For example, if a president inherited a $6 trillion budget and held real per-capita spending flat while population grew 2% and inflation averaged 3% over four years, the budget would increase to approximately $6.75 trillion—a $750 billion increase that critics could highlight while ignoring the restraint required to prevent even larger growth. These mathematical realities make it virtually impossible for presidents to show spending decreases in absolute dollar terms without implementing dramatic cuts that reduce real services below prior levels.
Additionally, infrastructure aging requires steadily increasing maintenance spending simply to maintain existing service levels. Roads, bridges, water systems, and government buildings built 50-70 years ago now require extensive repairs or replacement, costs that cannot be deferred indefinitely without catastrophic failures. The American Society of Civil Engineers estimates the U.S. faces a $2.6 trillion infrastructure funding gap over the next decade, representing spending increases necessary merely to prevent deterioration of existing assets rather than building anything new.
Crisis Response and Emergency Spending
No president can predict or prevent crises that demand emergency spending responses. Natural disasters, pandemics, economic recessions, and military conflicts generate spending surges that dwarf normal budget fluctuations and permanently reset baseline spending levels higher. The COVID-19 pandemic provided the most dramatic recent example, with Presidents Trump and Biden together enacting approximately $5 trillion in emergency relief and stimulus spending during 2020-2021. While pandemic spending eventually subsided, it left permanent increases in debt and interest costs that continue driving budgets higher.
Economic recessions automatically trigger spending increases through “automatic stabilizers”—unemployment insurance, food assistance, Medicaid, and other safety net programs that expand enrollment during downturns without requiring new legislation. Simultaneously, recessions reduce tax revenues, widening deficits and requiring additional borrowing. Presidents who inherit economies in recession or face economic crises during their terms inevitably oversee spending increases far exceeding those of presidents governing during economic expansions, regardless of their fiscal philosophies or budget priorities.
Military conflicts create similar dynamics. Wars in Afghanistan and Iraq cost approximately $2 trillion over two decades, while more recent conflicts continue requiring supplemental appropriations for weapons replacement, operational costs, and veteran healthcare that extends for decades after conflicts end. Presidents inheriting ongoing military operations or facing new security threats have little choice but to continue defense spending at elevated levels established by predecessors, with political costs of appearing weak on national security constraining their ability to implement significant reductions.
Presidential Spending Records: A Comparative Analysis
Examining specific presidential fiscal records illustrates how these structural factors manifest across administrations of both parties. While campaign rhetoric differs dramatically between candidates promising spending restraint versus government investment, actual governing records show remarkable consistency in spending growth across partisan divides.
George W. Bush: War and Recession (2001-2009)
President George W. Bush oversaw federal spending increases totaling approximately $6.9 trillion over his eight-year presidency, according to Brookings Institution analysis. When Bush took office in January 2001, annual federal spending stood at $1.9 trillion. By the time he left in January 2009, annual spending had reached $3.5 trillion—an 84% increase during his tenure. Multiple factors drove this expansion, beginning with the September 11, 2001 terrorist attacks that triggered wars in Afghanistan and Iraq, dramatically expanding defense and homeland security budgets.
The Medicare Part D prescription drug benefit, enacted in 2003, represented the largest expansion of entitlement spending since Medicare’s creation in 1965, adding approximately $550 billion in costs over its first decade. The 2008 financial crisis forced Bush to sign the Troubled Asset Relief Program (TARP) and initial economic stimulus measures totaling $700 billion to prevent complete economic collapse. Critics from both parties noted the irony of a president who campaigned on limited government principles overseeing some of the largest spending increases in American history, though Bush defenders correctly noted that wars and financial crises left little choice.
The Bush administration demonstrates how external events—terrorism, war, and economic crisis—drive spending increases that presidents cannot avoid without accepting unacceptable consequences. While Bush could have proposed different policies, the fundamental reality that his presidency would oversee massive spending increases was largely predetermined by the crises he faced rather than ideological preferences for bigger government.
Barack Obama: Recovery and Healthcare (2009-2017)
President Obama inherited the worst economic crisis since the Great Depression, with unemployment heading toward 10% and the financial system teetering on collapse. His administration enacted approximately $5.0 trillion in new spending over eight years, according to fiscal experts, with the American Recovery and Reinvestment Act ($831 billion in economic stimulus) representing the largest single initiative. The Affordable Care Act expanded Medicaid coverage to millions of Americans while providing subsidies for health insurance purchases, adding hundreds of billions in healthcare spending over subsequent decades.
However, Obama’s spending record shows important nuances often lost in political rhetoric. While total annual spending increased from $3.5 trillion in 2009 to $4.0 trillion in 2017—a 14% increase—this represents the slowest spending growth rate of any president since Eisenhower when measured as a percentage of the economy. Spending as a share of GDP actually declined from 24.4% in 2009 to 20.7% in 2017 as the economy recovered and emergency pandemic spending wound down. Obama proposed significantly higher tax increases than occurred, but Republican congressional opposition blocked most of his proposed revenue increases while supporting most defense spending increases.
The Obama years demonstrate that even when a president exercises relative spending restraint—his proposed budgets consistently featured smaller spending increases than his predecessor—total outlays still increase substantially in absolute dollar terms. The combination of mandatory program growth, interest on debt accumulated before he took office, and necessary economic recovery spending ensured spending would reach new highs regardless of Obama’s fiscal preferences.
Donald Trump: Tax Cuts and Pandemic (2017-2021)
President Trump’s single four-year term saw federal spending increase from $4.0 trillion to $6.6 trillion—a 65% surge that represented the second-largest four-year spending increase in U.S. history after Franklin Roosevelt’s World War II spending. The COVID-19 pandemic accounted for approximately $2.1 trillion through the CARES Act and subsequent relief legislation, while Trump’s 2017 tax cuts reduced revenues by approximately $1.5 trillion over the decade, widening deficits despite Trump’s campaign promises to eliminate the national debt entirely.
Beyond pandemic spending, Trump oversaw defense budget increases from $590 billion in 2017 to $740 billion by 2020, fulfilling campaign promises to rebuild military capabilities. Farm subsidies expanded dramatically, student loan forgiveness programs continued despite Trump’s stated opposition, and infrastructure spending increased, all contributing to total spending growth of approximately $7.8 trillion over just four years. When Trump left office, annual spending stood at its highest level in American history outside of World War II, with structural deficits of nearly $2 trillion annually established before Biden’s inauguration.
Trump’s record demonstrates that campaign promises to dramatically reduce spending inevitably collide with governing realities. Despite genuine ideological commitment to smaller government and eliminating waste, Trump approved more spending in four years than Obama did in eight, partly due to the pandemic but also reflecting the difficulty of cutting programs with powerful political constituencies protecting them.
Joe Biden: Recovery and Infrastructure (2021-2025)
President Biden enacted legislation and executive actions costing approximately $6.6 trillion during his single term, according to Brookings analysis—matching Trump’s four-year total and nearly $5 trillion in COVID relief, infrastructure investment, and climate initiatives. The American Rescue Plan ($1.9 trillion), Infrastructure Investment and Jobs Act ($1.2 trillion), and Inflation Reduction Act ($740 billion) represented the largest domestic spending initiatives, while continued pandemic recovery needs and support for Ukraine added hundreds of billions more.
Like his predecessors, Biden proposed far more ambitious spending plans than Congress approved, with his Build Back Better agenda scaled down dramatically. However, Biden simultaneously proposed the largest tax increases on businesses and high earners in decades, attempting to offset spending increases with revenue growth. Congressional rejection of most tax proposals meant spending increases occurred without corresponding revenue increases, adding to deficits despite Biden leaving office with annual deficits smaller than the $3.1 trillion deficit he inherited from Trump’s final pandemic year.
By January 2025 when Biden left office, annual federal spending exceeded $7 trillion with structural deficits of approximately $2 trillion annually firmly established. While Biden defenders note that deficit reduction from the pandemic-peak levels of 2020 represented fiscal improvement, critics accurately observe that Biden added trillions to long-term debt projections and left spending at record peacetime levels. Both perspectives contain truth, illustrating how presidential fiscal legacies can be interpreted dramatically differently depending on chosen metrics and timeframes.
Donald Trump’s Second Term (2025-Present)
President Trump’s return to the White House following the 2024 election has already demonstrated the enduring pattern of spending increases. Despite campaign promises to implement dramatic spending reductions and eliminate government waste, Trump’s fiscal year 2027 budget proposes $1.5 trillion in defense spending—a 44% increase over 2026 levels—while implementing only modest 10% cuts to non-defense discretionary spending. The administration’s budget projects total annual spending of approximately $7.5 trillion in 2027, up from $7.0 trillion in 2026, representing a continuation of the upward spending trajectory that has characterized every modern presidency.
The budget proposal reflects the same constraints facing all presidents: mandatory spending increases driven by entitlement programs, rising interest costs on accumulated debt, and political realities that make significant spending reductions politically costly. While Trump’s budget proposes eliminating programs he characterizes as wasteful—cutting environmental grants, reducing foreign aid, and eliminating diversity initiatives—these cuts represent tiny fractions of total spending and are largely offset by defense increases and continuing mandatory program growth.

Why Breaking the Pattern Requires Political Courage Neither Party Has Shown
Understanding why spending increases persist across administrations requires acknowledging that the solutions are known but politically toxic. Every president receives detailed plans from Congressional Budget Office, Government Accountability Office, and think tanks across the ideological spectrum explaining exactly what policy changes would stabilize debt and control spending growth. These plans share common themes: raise retirement ages, means-test benefits, negotiate drug prices aggressively, raise taxes substantially, or some combination thereof.
The Entitlement Reform Challenge
Social Security and Medicare represent the largest drivers of long-term spending growth, with the Social Security and Medicare trustees reporting that both programs face insolvency within 10-15 years without reforms. Solutions are straightforward: gradually raising the retirement age to 69 or 70 to reflect longer lifespans, adjusting cost-of-living formulas to reduce benefit growth, means-testing benefits so wealthier retirees receive less, and increasing payroll taxes to cover shortfalls. Any combination of these changes would dramatically improve long-term fiscal outlook.
However, these reforms are political suicide. AARP and senior advocacy groups mobilize millions of older voters who consistently participate in elections at higher rates than younger Americans. Politicians who propose reducing benefits, even for future retirees not yet affected, face attack advertisements claiming they’re “destroying Social Security” or “pushing grandma off a cliff.” Consequently, both parties avoid serious entitlement reform, with Democrats opposing any benefit reductions and Republicans refusing tax increases, leaving the programs on paths to insolvency that future congresses must eventually address through emergency measures rather than thoughtful long-term planning.
The Tax Revenue Reality
The United States collects approximately 17% of GDP in federal tax revenues, below the historical average of 18% and well below the 30-40% collected by most other developed nations. Returning tax rates to levels that prevailed during the 1950s economic boom—when top marginal rates exceeded 90%—would generate trillions in additional revenue. However, both parties have contributed to the current low-tax environment: Republicans through aggressive tax cuts in 2001, 2003, and 2017, and Democrats through expanding tax credits and deductions that reduce effective rates even when nominal rates appear high.
Brookings Institution analysis indicates that even aggressive tax increases on the wealthy would raise at most 1-2% of GDP annually—significant but insufficient to close projected deficits without also addressing spending growth. Comprehensive tax reform closing loopholes, limiting deductions, and raising rates across the income spectrum could generate 4-5% of GDP, but such changes face opposition from constituencies protecting their specific tax benefits, from mortgage interest deductions to employer-provided health insurance exclusions.
The Defense Spending Dilemma
Defense spending now exceeds $900 billion annually when including Department of Energy nuclear programs and veteran affairs costs. The United States spends more on defense than the next ten countries combined, maintaining over 750 military bases in 80 countries worldwide. Substantial savings could be achieved through base closures, weapons systems cancellations, and force structure reductions, with defense experts across the political spectrum identifying hundreds of billions in potential savings from eliminating unnecessary programs.
However, defense cuts face bipartisan opposition from members of Congress protecting bases and defense contractors in their districts, veterans groups opposing benefit reductions, and foreign policy hawks warning that any reductions invite aggression from adversaries. Consequently, defense spending increases even when wars end, as each conflict leaves permanent spending increases for weapons replacement, future readiness investments, and decades of veteran healthcare costs that persist long after soldiers return home.
The Path Forward: What Would Actually Require Change
Breaking the pattern of ever-increasing presidential spending would require fundamental reforms that neither party has proven willing to pursue. The Simpson-Bowles Commission, appointed by President Obama, produced a comprehensive bipartisan plan in 2010 that would have stabilized debt through combination of spending cuts, tax increases, and entitlement reforms. The plan was rejected by both parties, with liberals opposing entitlement cuts and conservatives rejecting tax increases.
Structural Budget Rules
Some experts propose constitutional amendments or statutory requirements forcing balanced budgets or limiting spending growth to population plus inflation. Switzerland and Germany have implemented such rules successfully, though critics note that these countries have parliamentary systems where parties governing with majorities can implement necessary changes, unlike the U.S. system where divided government frequently prevents major reforms.
Balanced budget amendments face the challenge of economic recessions, when deficit spending is necessary to prevent depression. Exceptions allowing deficits during recessions create loopholes that Congress would inevitably exploit, while rigid rules without exceptions could force austerity during downturns that worsens economic pain. Nevertheless, some form of fiscal rules forcing lawmakers to confront trade-offs rather than borrowing to avoid difficult choices could improve long-term fiscal discipline.
Automatic Adjustment Mechanisms
Some countries have implemented automatic stabilizers that adjust benefits or taxes when programs face insolvency without requiring explicit congressional action. For example, Social Security benefits could be automatically reduced or payroll taxes increased when the trust fund falls below certain thresholds. This removes the political decision from Congress, forcing adjustments to occur through predetermined formulas rather than crisis negotiations.
However, automatic cuts would likely trigger congressional intervention to override the reductions, undermining their purpose. Americans generally oppose benefit cuts and tax increases in the abstract while supporting maintaining program solvency, creating a disconnect between preferences and policy requirements that automatic mechanisms alone cannot resolve.
Political Leadership and Public Education
Ultimately, changing the pattern of ever-increasing spending requires political leadership willing to tell Americans hard truths: that current benefit levels are unsustainable without major tax increases, that current tax levels are insufficient to fund current programs, and that closing the gap requires some combination of both. This requires leaders willing to spend political capital on unglamorous fiscal reforms rather than popular new programs, accepting that solving fiscal problems offers fewer political rewards than creating new initiatives.
Public education campaigns explaining the mathematics driving spending growth could build support for reforms, but such efforts require sustained messaging over years while opposition groups mobilize immediately against specific proposals. The diffuse benefits of long-term fiscal stability cannot compete politically with concentrated opposition from groups losing specific benefits or tax advantages, creating collective action problems that democracy struggles to solve even when the need for reform is clear.
Conclusion: Understanding the Inevitable
The pattern of every president spending more than their predecessor is not a failure of will or evidence of partisan hypocrisy. Instead, it reflects mathematical realities of governing a growing nation with demographic shifts, accumulated obligations, and crisis responses that make spending reduction extraordinarily difficult without fundamental reforms neither party has proven willing to pursue. Understanding these dynamics helps citizens evaluate presidential fiscal records more realistically, recognizing that campaign promises to dramatically cut spending face constraints that ensure spending increases regardless of who wins elections.
This doesn’t mean fiscal policy doesn’t matter or that all spending increases are inevitable. Presidents make real choices about priorities, with different administrations favoring defense versus domestic spending, tax cuts versus deficit reduction, and new programs versus fiscal restraint. These choices have genuine consequences for who benefits from government and how burdens are distributed. However, the overall direction of total spending—persistently upward—remains remarkably consistent across administrations because the forces driving it are structural rather than ideological.
Breaking this pattern would require political courage from leaders willing to tell voters that current trajectories are unsustainable and that realistic solutions require sharing sacrifice through benefit reductions and tax increases rather than the politically appealing fantasy that waste elimination alone can solve fiscal challenges. Until both parties commit to such honesty, the pattern will continue: each president will campaign promising fiscal responsibility, govern over increased spending, and leave office having added to deficits while blaming their predecessor and opposition party for the structural realities that ensure spending increases regardless of who governs. Understanding this pattern is the first step toward eventually building the political coalition necessary to break it.