Marketing budgets in 2026 aren’t expense lines—they’re growth engines. Yet 59% of CMOs say they still don’t have enough budget to complete their strategy, according to recent research. The businesses winning in 2026 aren’t those spending the most. They’re the ones making every dollar count.
According to February 2026 data, 83% of B2B marketing decision-makers expect their budgets to rise over the next 12 months. Average marketing budgets have grown to 9.4% of company revenue (up from 7.7% in 2024), with the median increase at 5% but the average rise at 22%—reflecting ambitious growth strategies by market leaders.
Yet budget growth means nothing without strategic allocation. The “spray and pray” approach of distributing funds equally across channels is dead. In 2026, sophisticated marketers build dynamic budgets tied to measurable outcomes, shifting resources toward what works in real-time, cutting what doesn’t, and maintaining reserves for unexpected opportunities.
This comprehensive guide reveals exactly how to create a marketing budget that drives growth in 2026, based on latest benchmarks, proven frameworks, and real-world testing from Fortune 500 companies to startups. You will learn strategic allocation principles, channel-by-channel recommendations, measurement frameworks, and critical mistakes costing teams results.
Whether you’re a CMO planning annual budgets, marketing director optimizing spend, or founder allocating limited resources, this guide transforms budgeting from administrative task into competitive advantage.
Understanding Marketing Budgets in 2026
Before building your budget, grasp what’s changed:
2026 Definition: A marketing budget is not a cost tracking mechanism—it’s a financial framework directing investment across campaigns, channels, and technologies, governed by data and strategy, connecting every dollar to measurable business outcomes.
Three Strategic Purposes:
1. Resource Allocation: Ensures balanced investment across paid, organic, events, and partnerships based on expected ROI.
2. Performance Measurement: Connects spend to KPIs like customer acquisition cost (CAC), lifetime value (LTV), and pipeline contribution.
3. Strategic Agility: Enables real-time budget adjustments, redirecting spend toward high-performing channels and campaigns.
What Changed from 2024-2025:
Then: Annual budgets locked in October, reviewed quarterly
Now: Dynamic portfolios assessed monthly, reallocated weekly based on performance
Then: Budgets as percentage of revenue (set and forget)
Now: Revenue-driven models tied to growth targets with built-in flexibility
Then: Channel equality (equal distribution)
Now: Performance-based allocation (winners get more)
Understanding how to build a strong marketing plan provides foundation for budget strategy.
2026 Marketing Budget Benchmarks
Current data from Gartner, Forrester, and industry research:
Budget as Percentage of Revenue
Overall Average: 9.4% of company revenue (Gartner 2026)
By Company Type:
- Startups (aggressive growth): 15-30% of ARR
- B2B SaaS (growth stage): 8-15% of revenue
- Established B2B: 5-10% of revenue
- E-commerce: 10-20% of revenue
- Fortune 500 (mature markets): 7-8% of revenue
Historical Context: Marketing budgets peaked at 9.5% in 2022, dropped to 7.7% in 2024, and rebounded to 9.4% in 2026—reflecting renewed confidence in growth investments.
Budget Growth Trends
83% of B2B marketers expect budgets to rise in next 12 months
Growth Rates:
- Median increase: 5%
- Average increase: 22% (driven by aggressive growth companies)
- Overall growth rate: 3.3% average (down from 5.8% in 2024)
The Reality: While budgets grow nominally, inflation and rising media costs mean real value stays relatively flat. Success comes from working smarter, not just spending more.
Channel Allocation Trends
Digital dominates: 72% of marketing budget goes to digital channels
2026 Growth Areas:
- AI SEO investment: 98% plan to increase spend
- Community building: 69% increasing investment
- Influencer marketing: 78% budget growth
- CRO/UX optimization: 52% increasing
2026 Decline Areas:
- Traditional display ads: 63% keeping flat
- Facebook paid ads: 36% decreasing
- Content creation volume: 31% reducing spend
The Pattern: Teams cut channels with declining reach, opaque ROI, or inflated costs. They double down on measurable, efficient channels with clear attribution.
Ad Spending Projections
Global ad spending tops $1 trillion in 2026 (eMarketer), with digital accounting for 75%+ of total media spend.
Growth Forecasts:
- Dentsu: 4.9% global ad spend growth
- Digital marketing: 11.9% projected growth
- ROI advantage: Digital delivers 28% higher ROI than traditional methods
Learn about marketing for business growth strategies.
Strategic Framework: Building Your 2026 Marketing Budget
Proven seven-step approach:
Step 1: Align Budget with Business Objectives
Before Allocating a Single Dollar:
Your marketing budget serves business goals, not the other way around. Start with crystal-clear objectives.
Key Questions:
- What is the company’s revenue target for 2026?
- Are we prioritizing growth, profitability, or market share?
- Are we launching new products or entering new markets?
- What is our customer retention vs. acquisition focus?
- What specific business outcomes does marketing support?
Document Goals with Specific Targets:
Bad Goal: “Increase brand awareness” Good Goal: “Generate 500 qualified leads monthly by Q3, contributing to $2M pipeline”
Bad Goal: “Improve social media presence” Good Goal: “Achieve 25% engagement rate on LinkedIn, driving 100 demo requests quarterly”
Why This Matters: A new product launch demands heavy investment in awareness and lead generation. A retention focus requires more customer marketing and loyalty programs. Different objectives = different allocations.
Step 2: Analyze Past Performance
You Can’t Plan Forward Without Understanding Where You’ve Been:
Review last year’s budget performance thoroughly:
What to Review:
- ROI by Channel: Which initiatives provided highest return?
- Cost per Acquisition: What did it cost to acquire customers via each channel?
- Lead Quality: Which sources produced best-converting leads?
- Campaign Performance: What worked exceptionally well or poorly?
- Budget Utilization: Did you under or overspend in categories?
AI-Powered Analysis: Use AI reporting tools to gain faster, more accurate insights into past campaigns, identifying patterns humans might miss.
The Audit:
- Did spend align with business objectives?
- Which 20% of activities drove 80% of results?
- What expensive efforts produced minimal return?
- Where were you under-invested?
Output: Clear picture of what works, what doesn’t, and where opportunities exist.
Step 3: Research Market Conditions and Trends
External Factors Shape 2026 Allocations:
Economic Environment:
- Inflation projections and consumer spending
- Industry-specific economic indicators
- Regulatory changes affecting marketing
Competitive Landscape:
- What are competitors investing in?
- Where are they vulnerable?
- What new entrants threaten market position?
Technology Shifts:
- AI integration costs and opportunities
- New channels gaining traction
- Platform algorithm changes
Consumer Behavior:
- Zero-click searches now 58-60% of Google queries
- Voice and visual search growing
- Preference for authentic content over AI-generated
Channel Trends:
- SEO budgets rebounding (61% increasing vs. 44% last year)
- Community and influencer marketing accelerating
- Traditional display ads stagnating
The Insight: Understanding what’s changing in your industry helps anticipate shifts affecting budget allocation.
Step 4: Define Budget Categories
2026 Updated Categories:
Digital Marketing & Campaigns (40-50%):
- Paid media (search, social, display, programmatic)
- SEO and content marketing
- Email marketing automation
- AI-powered campaign optimization tools
Technology & Tools (15-25%):
- Marketing automation platforms
- CRM systems
- Analytics and reporting tools
- AI solutions (content, personalization, optimization)
- Tool integration and training costs
Creative & Content (10-20%):
- Video production
- Design and visual assets
- Copywriting and content creation
- Interactive experiences
- AI assistance balanced with human creativity
Events & Experiences (5-15%):
- In-person events (rebounding post-pandemic)
- Webinars and virtual events
- Account-based marketing experiences
- Trade shows and conferences
Talent & Outsourcing (15-25%):
- Staff salaries and benefits
- Agency partnerships
- Freelancers and contractors
- Training and skill development (AI, data, RevOps)
Innovation Fund (5-10%):
- Experimental channels and technologies
- Testing new platforms
- Pilot programs
- Early adoption opportunities
The Percentages: These ranges vary by industry, company stage, and goals. Use as starting framework, not rigid rules.
Step 5: Establish Performance Metrics
Every Budget Line Ties to Measurable Outcomes:
Lead Generation Metrics:
- Cost per lead (CPL)
- Lead quality scores
- Lead-to-opportunity conversion rate
- Cost per marketing qualified lead (MQL)
Revenue Metrics:
- Marketing-attributed revenue
- Pipeline contribution
- Customer acquisition cost (CAC)
- Customer lifetime value (LTV)
- LTV:CAC ratio (target 3:1 or higher)
Efficiency Metrics:
- Return on ad spend (ROAS)
- Cost per click (CPC)
- Conversion rates by channel
- Organic traffic growth
Brand Metrics:
- Brand awareness scores
- Share of voice
- Net promoter score (NPS)
- Website traffic and engagement
Strategic Metrics:
- Market share growth
- Customer retention rate
- Sales cycle length
- Win rate improvements
Dashboard Setup: Create monthly KPI dashboards tracking 5-7 critical metrics. Avoid vanity metrics—focus on business impact.
Step 6: Build in Flexibility and Reserves
2026 Requires Agility:
The 70-20-10 Model:
70% Core Budget: Allocated to proven, reliable channels delivering consistent ROI
20% Growth Budget: Invested in scaling promising channels and optimizing existing campaigns
10% Innovation Budget: Reserved for experimental channels, new technologies, and emerging opportunities
Contingency Planning: Reserve 10% for unexpected opportunities or challenges. Economic volatility requires rapid response capabilities.
Scenario Planning:
- Best case: Market conditions exceed expectations—where do you invest additional funds?
- Expected case: Market performs as forecasted—budget proceeds as planned
- Worst case: Economic downturn or revenue miss—what gets cut first?
Monthly Reallocation: Don’t lock budgets annually. Review monthly. Shift funds from underperforming to high-performing channels continuously.
Learn about competitive analysis for market intelligence.
Step 7: Document, Approve, and Monitor
Finalize Your Budget:
Confirm Alignment: Ensure marketing spend supports company objectives for 2026.
Validate Assumptions: Double-check growth projections, campaign costs, staffing needs.
Document Contingencies: Include notes for scenario adjustments and reallocations.
Obtain Approvals: Share with leadership and stakeholders, incorporating feedback.
Set Up Tracking: Implement dashboards monitoring spend and performance continuously.
Regular Reviews: Weekly spend checks, monthly performance reviews, quarterly strategic assessments.
Cross-Functional Alignment: Marketing, Sales, Customer Success, and RevOps collaborate to ensure budgets support shared goals.
Channel-by-Channel Budget Recommendations
Detailed allocation guidance for 2026:
SEO & Organic Content (15-25%)
Why Invest:
- Highest ROI B2B channel (748% ROI with 7-9 month breakeven)
- #1 ROI-generating channel according to 2026 marketers
- Compounds over time (content builds on itself)
- Lower ongoing costs than paid channels
Budget Allocation:
- Content creation: 40%
- Technical SEO: 20%
- Tools and software: 20%
- Link building: 10%
- Freelance/agency support: 10%
2026 Trend: 61% of marketers increasing SEO budgets (up from 44% in 2025). Confidence rebounding after AI uncertainty.
Minimum Viable Investment: $500-1,000/month (small business) to $5,000-15,000/month (enterprise)
Paid Search & PPC (20-30%)
Why Invest:
- High intent traffic
- Measurable ROI
- Quick results
- Scales with budget
Budget Allocation:
- Ad spend: 70-80%
- Management/optimization: 15-20%
- Creative/testing: 5-10%
2026 Trend: Remains core channel. Paid search offers clearest attribution in environment where third-party signals degrade.
Cost Benchmarks:
- Google Ads CPC: $1-$10+ depending on industry
- Conversion rates: 2-5% average
- ROAS target: 3:1 minimum
Social Media Marketing (10-20%)
Organic Social (5-10%):
- Content creation
- Community management
- Scheduling tools
- Creative assets
Paid Social (5-10%):
- Facebook/Instagram ads
- LinkedIn advertising
- TikTok and emerging platforms
2026 Trend: Facebook paid declining (36% reducing spend). LinkedIn and community-focused platforms growing. Influencer marketing seeing 78% budget growth.
Strategic Shift: From volume content to strategic community building. Quality over quantity.
Email Marketing (5-10%)
Why Invest:
- Direct channel you control
- High ROI ($36-42 per dollar spent)
- Personalization at scale with AI
- Retention and nurturing focus
Budget Allocation:
- Platform/tools: 40%
- Content creation: 30%
- Design/templates: 15%
- Automation setup: 15%
2026 AI Opportunity: AI personalization driving 4x higher conversions through individual-level customization.
Content Marketing (10-15%)
Beyond Blog Posts:
- Video production
- Podcasts
- Webinars
- Interactive content (quizzes, calculators)
- Long-form guides and resources
Budget Allocation:
- Creation: 50%
- Distribution/promotion: 30%
- Tools and platforms: 20%
2026 Note: Content creation volume spend declining (31% cutting) but quality investment increasing. Shift from quantity to strategic, high-value pieces.
Marketing Technology (15-20%)
Critical Stack Components:
- CRM: Customer relationship management
- Marketing automation: Email, workflows, lead nurturing
- Analytics: Google Analytics, attribution platforms
- AI tools: Content creation, optimization, personalization
- SEO tools: Keyword research, tracking, optimization
2026 Recommendation: Minimum viable stack costs $200-500/month (startups) to $5,000-15,000/month (enterprise).
Avoid Tool Bloat: Companies average 106 SaaS applications. Each adds coordination overhead. Choose essential tools, master them completely.
Learn about how to use AI for content marketing to leverage technology efficiently.
Events & Experiential (5-15%)
In-Person Events: Rebounding strongly post-pandemic. Personal connection valued in AI-saturated environment.
Budget Allocation:
- Trade shows/conferences: 40%
- Hosted events: 30%
- Webinars: 20%
- Sponsorships: 10%
Strategic Value: High-value relationships, brand experiences, thought leadership positioning.
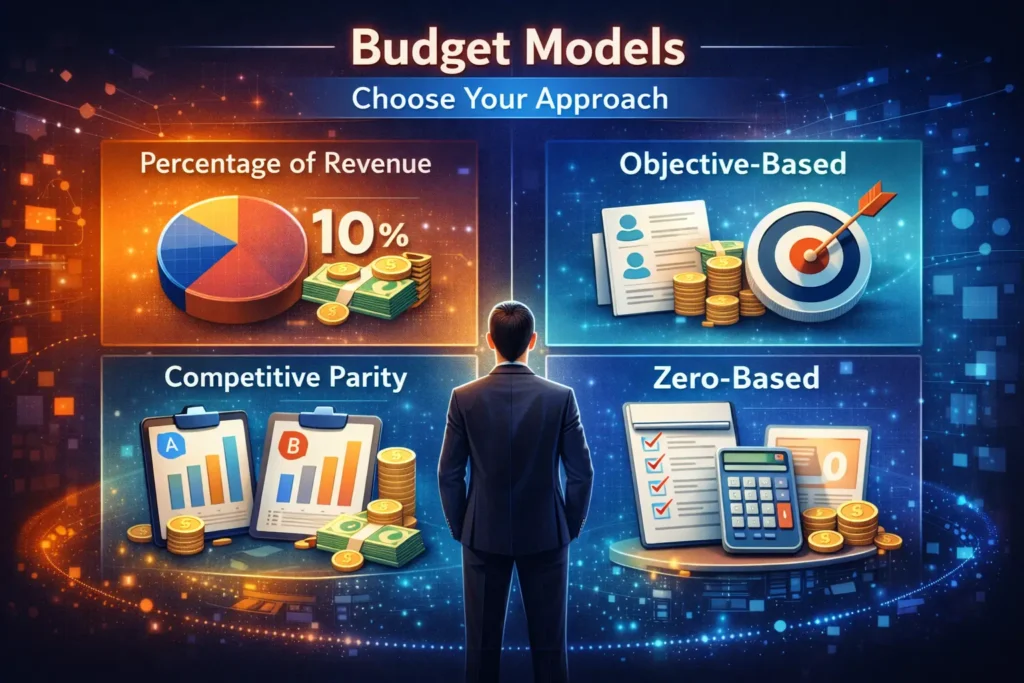
Budget Models: Choose Your Approach
Different frameworks for different situations:
Percentage of Revenue Model
How It Works: Allocate fixed percentage of company revenue to marketing.
Pros:
- Simple and predictable
- Scales with business growth
- Easy to benchmark against industry
Cons:
- Doesn’t account for growth stage needs
- Can limit investment when growth requires aggression
Best For: Established businesses with steady growth trajectories.
Objective-Based Model
How It Works: Calculate budget needed to achieve specific goals (e.g., 1,000 new customers × $500 CAC = $500K budget).
Pros:
- Directly tied to outcomes
- Justifies investment clearly
- Focuses on results
Cons:
- Requires accurate cost projections
- May overlook brand-building activities
Best For: Growth-stage companies with clear acquisition targets.
Competitive Parity Model
How It Works: Match or exceed competitor spending levels.
Pros:
- Maintains competitive position
- Industry benchmarking built-in
Cons:
- Expensive and potentially wasteful
- Ignores your unique situation
Best For: Market leaders defending position or challengers attacking leaders.
Zero-Based Budgeting
How It Works: Start from zero. Justify every dollar based on expected return.
Pros:
- Eliminates historical waste
- Forces strategic thinking
- Optimizes allocation
Cons:
- Time-intensive process
- Requires sophisticated analysis
Best For: Companies seeking maximum efficiency or major strategic shifts.
Hybrid Model (Recommended)
How It Works: Combine approaches—use percentage of revenue as starting point, adjust for objectives, build zero-based justification for major initiatives.
Why It Works: Balances simplicity with strategic rigor. Provides framework while maintaining flexibility.
Common Marketing Budget Mistakes
Avoid widespread errors:
Mistake 1: Treating Budget as Static Expense
The Error: Locking in annual budgets in October and never adjusting.
Why It Fails: Markets change, campaigns perform differently than expected, opportunities emerge. Rigidity kills ROI.
The Fix: Build dynamic budgets reviewed monthly with reallocation authority.
Mistake 2: Allocating Based on History, Not Performance
The Error: “We spent $X on trade shows last year, so we’ll spend $X again this year.”
Why It Fails: Past spend doesn’t justify future investment. Performance does.
The Fix: Zero-base every category. Justify investment based on expected return, not tradition.
Mistake 3: Spreading Budget Too Thin
The Error: Distributing funds equally across 10 channels so none receive adequate investment.
Why It Fails: Better to dominate two channels than dabble in ten. Insufficient investment produces insufficient results everywhere.
The Fix: Concentrate on 3-5 core channels. Master them before expanding.
Mistake 4: No Clear Metrics
The Error: Spending without defined success criteria or measurement systems.
Why It Fails: Can’t optimize what you don’t measure. Can’t prove value to leadership without data.
The Fix: Establish KPIs for every budget line. Track religiously. Report regularly.
Mistake 5: Ignoring Customer Acquisition Cost
The Error: Focusing on revenue without understanding what it costs to acquire customers.
Why It Fails: You can “buy” revenue unprofitably. Growing at unsustainable CAC leads to failure.
The Fix: Track CAC religiously. Maintain LTV:CAC ratio of 3:1 or higher. Adjust spending when economics break.
Mistake 6: Forgetting Brand Investment
The Error: 100% performance marketing, 0% brand building.
Why It Fails: Short-term performance depends on long-term brand strength. All performance, no brand leads to rising acquisition costs.
The Fix: Balance short-term performance (60-70%) with long-term brand building (30-40%).
Mistake 7: Tool Bloat
The Error: Subscribing to every new SaaS tool that launches.
Why It Fails: Each tool adds cost and coordination overhead. Many duplicate functionality.
The Fix: Maintain minimum viable stack. Resist shiny object syndrome. Master existing tools before adding new ones.
Measuring Marketing Budget ROI
Track what matters:
Essential Metrics
Marketing ROI Formula: (Revenue Attributed to Marketing – Marketing Cost) / Marketing Cost × 100
Example: ($500K revenue – $100K marketing cost) / $100K = 400% ROI
Channel-Specific ROI: Calculate separately for each major channel to identify top performers.
Attribution Models
First-Touch Attribution: Credits first interaction for conversion.
Last-Touch Attribution: Credits final interaction before purchase.
Multi-Touch Attribution: Distributes credit across all touchpoints.
2026 Reality: Attribution is noisier than ever. Third-party signals degrade. Focus on channels that stay measurable (paid search, email, CRO).
Key Performance Indicators
Track Monthly:
- Total marketing spend vs. budget
- Cost per lead by channel
- Conversion rates
- Customer acquisition cost
- Pipeline contribution
- Revenue attribution
Review Quarterly:
- ROI by major initiative
- Budget utilization rates
- Forecast vs. actual performance
- Strategic goal progress
The Future: 2026 and Beyond
Emerging trends shaping budgets:
AI Integration Costs: Budget for both AI tools and human expertise to use them effectively. The “Human + Machine” model requires investment in both.
First-Party Data Infrastructure: With third-party cookies dying, invest in first-party data collection, management, and activation systems.
Agile Budget Management: Monthly or even weekly reallocation becomes standard. Annual planning remains, but execution is dynamic.
Community and Owned Media: Growing budgets for building owned audiences (communities, email lists) that don’t depend on rented platforms.
Experience Over Interruption: Shift from interruptive ads to valuable experiences—interactive content, tools, educational resources.
Conclusion: Transform Budget from Spreadsheet to Growth Engine
Marketing budgets in 2026 determine who wins and who gets left behind. The companies succeeding aren’t spending most—they’re spending smartest.
Key Takeaways:
- 83% of B2B marketers expect budget increases in next 12 months
- Average marketing budgets now 9.4% of revenue (up from 7.7% in 2024)
- Digital represents 72% of marketing spend; digital ROI 28% higher than traditional
- SEO delivers 748% ROI with 7-9 month breakeven (highest ROI channel)
- 61% increasing SEO budgets; 78% growing influencer spend; 69% expanding community
- LTV:CAC ratio should be 3:1 or higher for sustainable growth
- Dynamic budgets reviewed monthly outperform annual locked budgets
- Reserve 10% for innovation and 10% for contingencies
- Track 5-7 critical KPIs monthly; avoid vanity metrics
- Concentrate investment in 3-5 core channels rather than spreading thin
What To Do Now:
This Month: Analyze last year’s performance, define 2026 objectives, establish baseline benchmarks Next 90 Days: Build budget using seven-step framework, obtain approvals, implement tracking This Year: Review monthly, reallocate based on performance, optimize continuously
The Bottom Line:
Your marketing budget is not a cost to be minimized—it’s an investment to be optimized. In 2026, the businesses winning treat budgets as dynamic portfolios, shifting resources to what works in real-time, cutting what doesn’t, and maintaining reserves for opportunities.
For comprehensive marketing guidance, read our related guides on how to build a strong marketing plan, marketing for business growth, and competitive analysis.
Build your budget strategically. Make every dollar count. Your growth depends on it.